PHP(6) Log file graph
ログファイルからデータの取得と描画
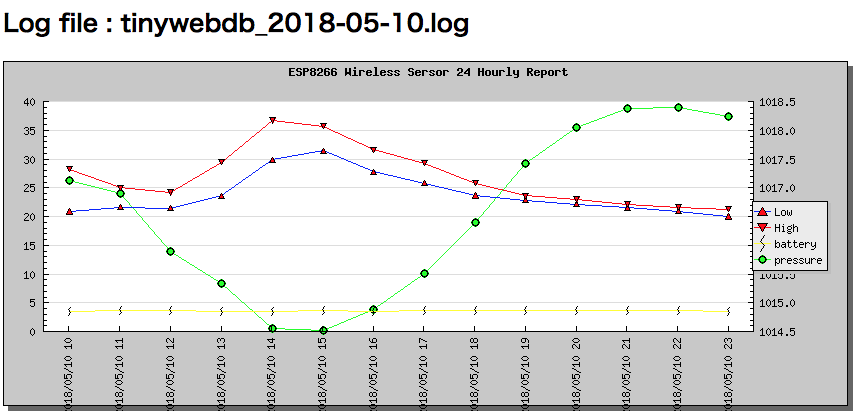
TinyWebDBに、センサーデータ収集ログを解析して、画像にした!表示したのでは、温度(最高、最低)、気圧、バッテリー電圧。
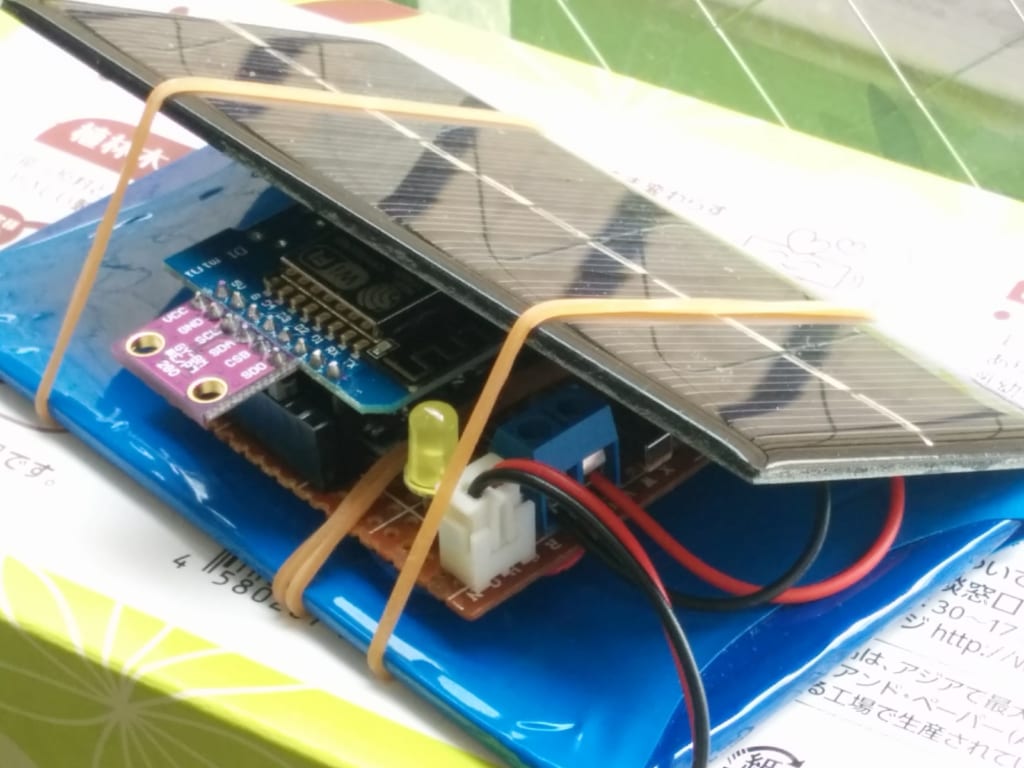
ハードウェアの制作はこちら
https://uc4.net/2018/04/02/wemos-d5-weather-bureau/
送信プログラムはこちら
https://github.com/edu2web/TinyWebDB-WeatherStation
今回は、受信データの描画方法を説明する。
- fileを配列に読み込む
- json_decodeでディコード
- 描画データ配列生成
- jpgraphで描画する
データの取得
ファイル名draw.phpとする。
<?php
include ("./jpgraph/jpgraph.php");
include ("./jpgraph/jpgraph_line.php");

$tempers = file($_GET['logfile']);
$p_time = 0;
$datax = array();  // Local time p_time, "2001-04-01","2001-04-02","2001-04-03",...
$datay = array();  // temperature p_low
$data2y = array(); // temperature p_high
$datap = array();  // pressure
$datab = array();  // battery

foreach($tempers as $temper) {
        list($dummy,$tagValue) = explode('--', $temper);

        $obj = json_decode($tagValue);
        $temp = round($obj->{'temperature'}, 2);
        $localt = $obj->{'localTime'};
        $pressure = $obj->{'pressure_hpa'};
        $battery = $obj->{'battery_Vcc'};
        list($ldate,$ltime) = explode(' ', $localt);
        $p_time2 = $ldate . " " . substr($ltime, 0, 2); // Truncat to Hour

        if ($p_time2 != $p_time) {
                if ($p_time) {
                        array_push( $datax, $p_time);
                        array_push( $datay, $p_low);
                        array_push( $data2y, $p_high);
                        array_push( $datap, $pressure);
                        array_push( $datab, $battery);
                        // echo "$p_time, $p_low, $p_high <br>";
                }
                $p_time = $p_time2;
                $p_high = $temp;
                $p_low = $temp;
        } else {
                $p_low = ($p_low > $temp or $p_low == 0) ? ($temp) : ($p_low);
                $p_high = ($p_high < $temp or $p_high == 0) ? ($temp) : ($p_high);
        }
}

array_push( $datax, $p_time);
array_push( $datay, $p_low);
array_push( $data2y, $p_high);
array_push( $datap, $pressure);
array_push( $datab, $battery);

// data ready for JpGraph
データの描画
TinyWebDBに、センサーデータ収集ログを解析した画像でした!