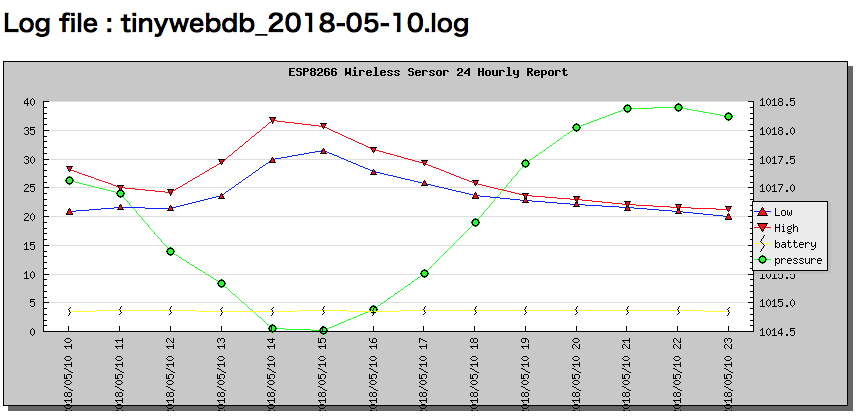
TinyWebDB log with Graph chen | June 28, 2018 | TinyWebDB API | No Comments TinyWebDBに、センサーデータ収集ログを解析して、画像にした! 表示したのでは、温度(最高、最低)、気圧、バッテリー電圧。 縦方向2軸しかできないから、バッテリーの電圧がみつらい。 Related Posts TinyWebDB log with Graph No Comments | Jun 28, 2018 TinyWebDB publish a Demo Code on github 1 Comment | Nov 2, 2016 WP-TinyWebDB-API Demo App Sample 1: App with Slug No Comments | Oct 31, 2012 TinyWebDB API Tester on Google Play No Comments | Feb 9, 2013 About The Author chen Add a Comment Cancel replyYour email address will not be published. Required fields are marked *Comment:*Name:* Email Address:* Website: Save my name, email, and website in this browser for the next time I comment. Δ